@europesays @UnitedStates @labplot@lemmy.kde.social @dataisbeautiful
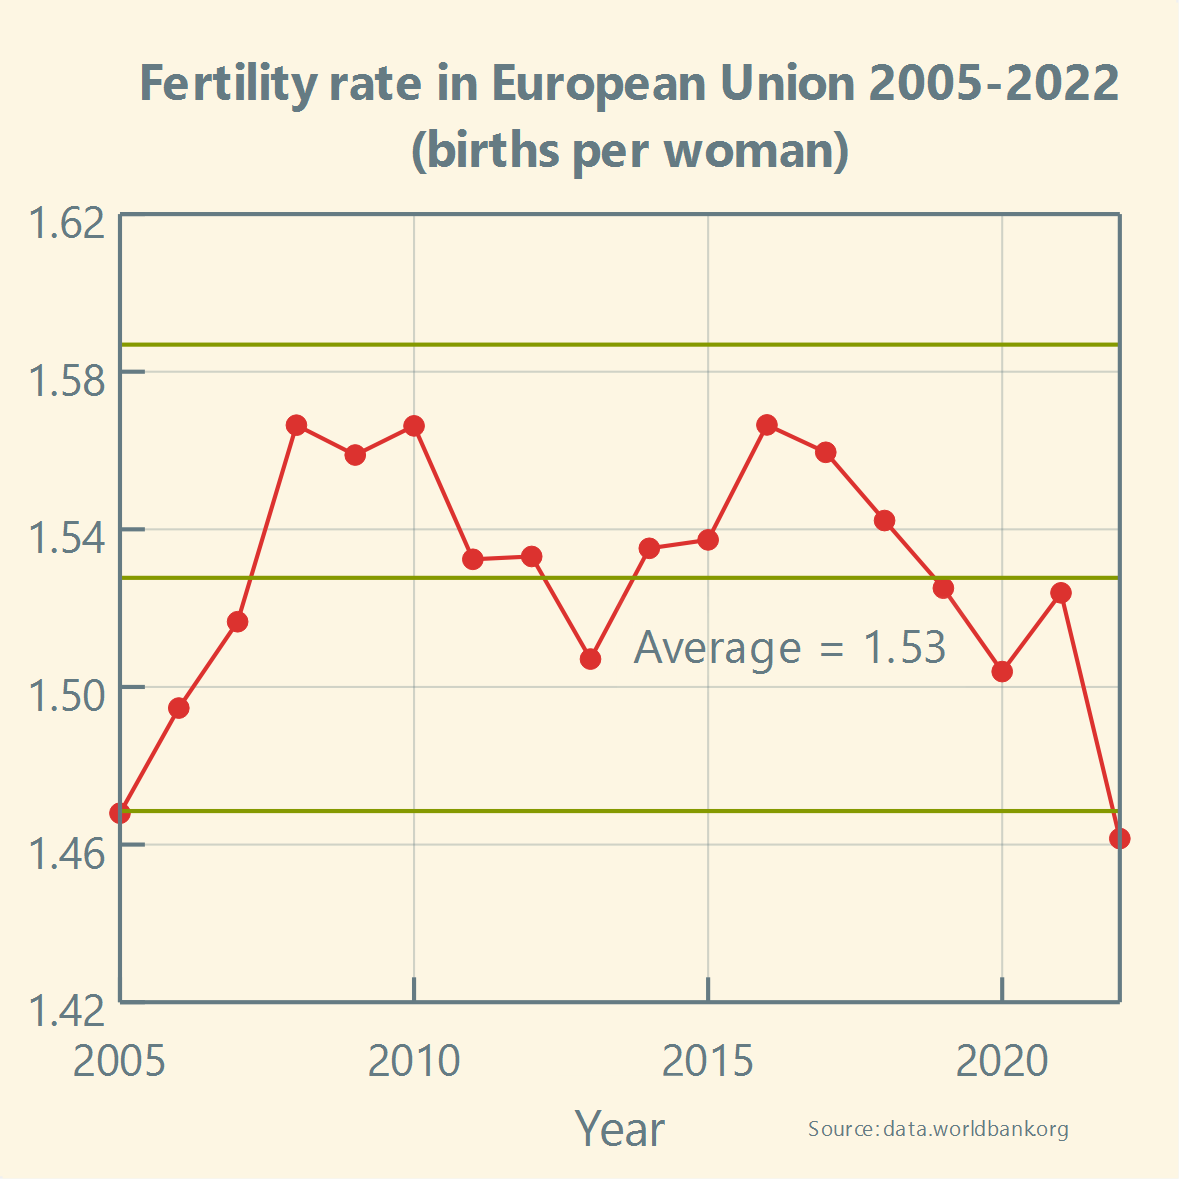
Has the #FertilityRate in the #US been stable over the past two decades? And how does it compare to the #EU?
Boosts appreciated! :boost_love:🚀
#Europe #Future #EU #Europa #Fertility #Politics #Healthcare #Health #BirthRate #Demography #Population #Biology #News #Community #Statistics #FreeSoftware #OpenSource #ControlChart #LabPlot #Data #dataViz #USA #America #Trump #Musk

@coucouf @europesays @labplot@lemmy.kde.social @dataisbeautiful
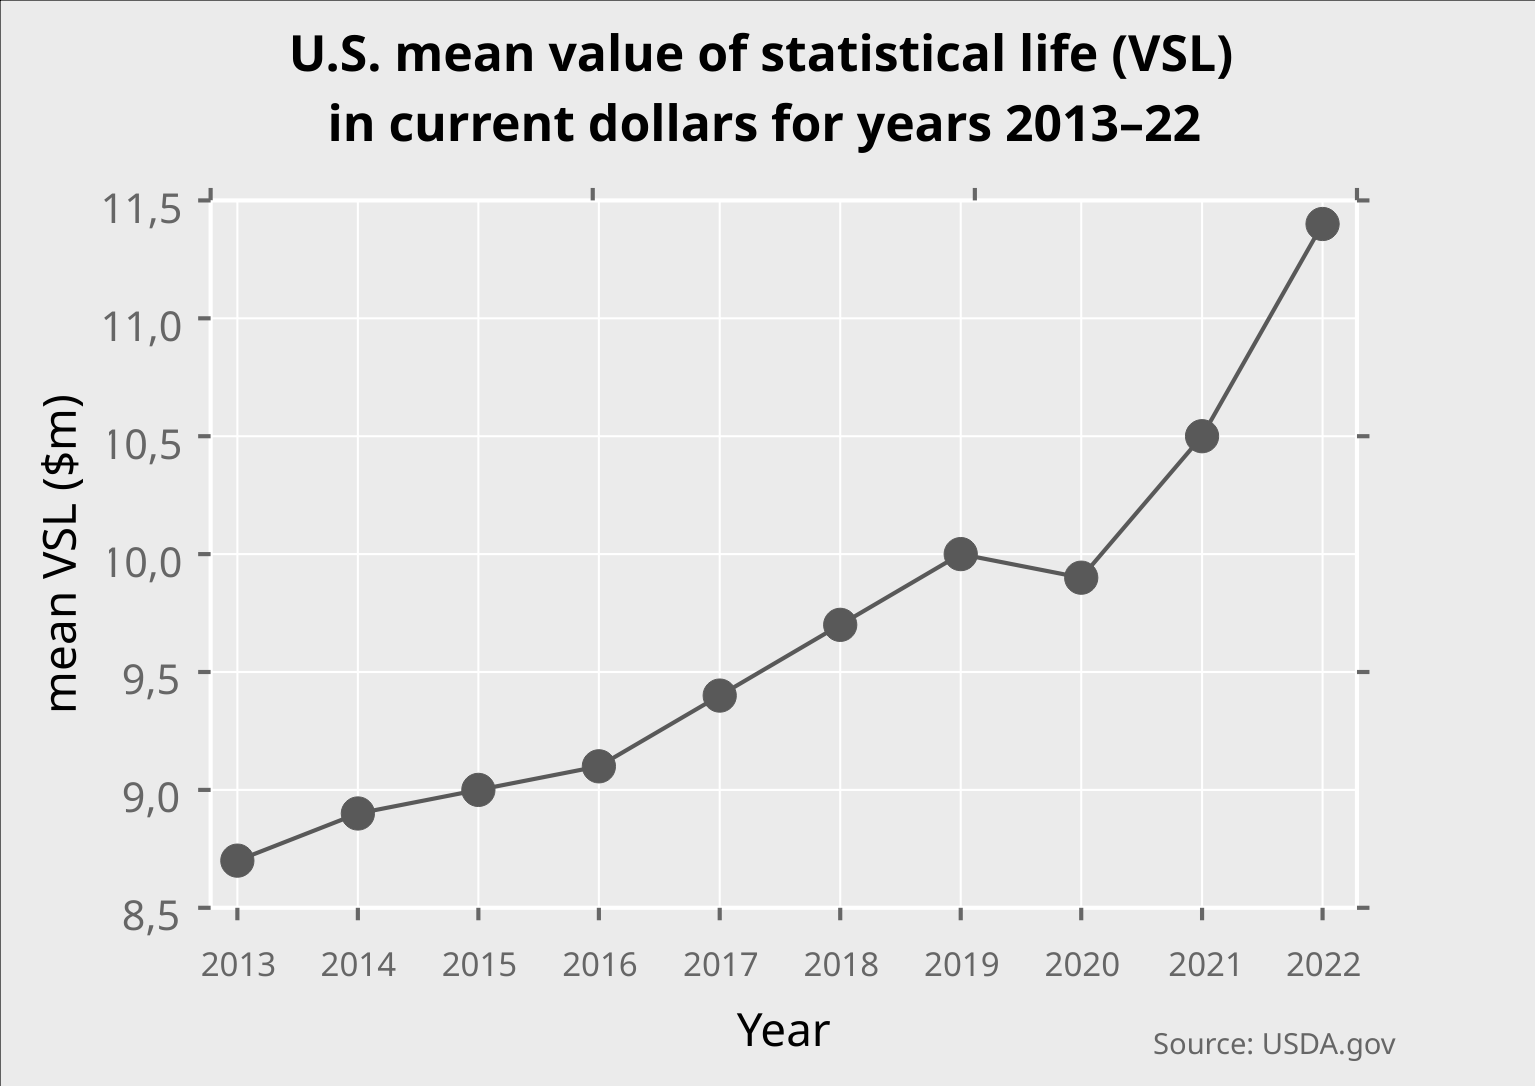
Thank you for your comment. For these types of charts describing variation in data, which also include upper and lower limits on the values that contain probable noise, not using 0 at the start on the y-axis makes sense, as it makes it easier to analyze this variation and detection of potential signals.
We believe that Howard Wainer certainly would not recommend blindly applying this principle to all cases.